https://knowledge.civilgeo.com/dam-break-analysis/
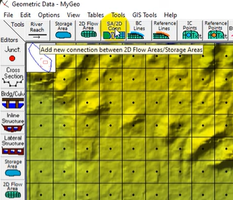
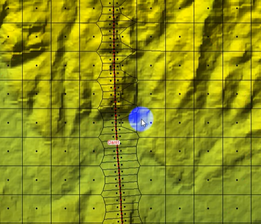
1. SA/2D Connection (drawing the dam)
1. This tool allows you to create bridges, wears and other structures.
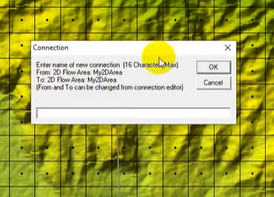
2. Draw the line from the left side to the right side of the river. Double click to end the drawing.
3. A dialog box appears: Enter name of new connection (16 Characters Max).
2. Editing the mesh around the structure
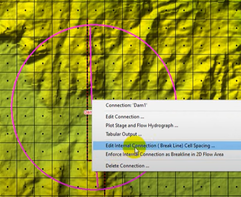
4. Click on the created dam. Select Edit Internal Connection (Break Line) Cell Spacing ...
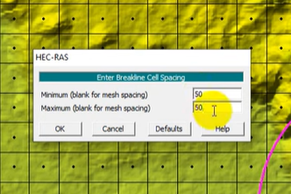
5. A dialog box appears, asking the Minimum and Maxim mesh spacing. This is asked because, in order to have a better simulation of the dam, we can require a different cell size around the dam.
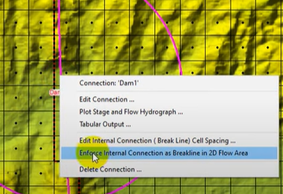
6. Click on the created dam. Select Enforce Internal Connection as Breakline in 2D Flow Area. The models recreats the mesh around the dam.
7. Save geometry.
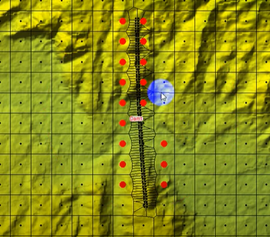
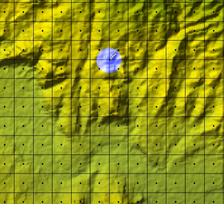
If red dots appears, it means that the new minimum and maximum mesh spacing selected at (6) are not appropriate for the structure. Try to select larger values.
In this case the mesh has been recreated without red dots around the dam structure.
3. Weir/Embankment modelling
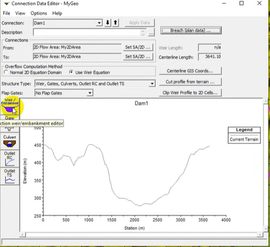
1. R-Click on the structure > Edit Connection... to open the Connection Data Editor.
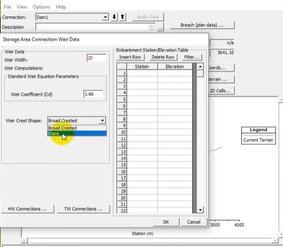
2. Click on the Weir/Embankment button. The dialogue box called Storage Area Connection Weir Data will open.
3. In the new dialogue box you can specify the following parameters:
- Station/Elevation coordinates of the weir;
- Weir Crest Shape (Broad Crested/Ogee);
- Weir Width;
- Weir Coefficient (Cd).
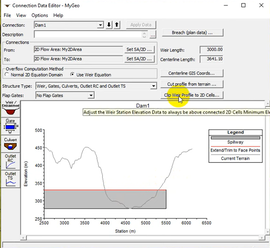
4. On RASMAPPER, inside the created geometry tree, right click on 2D Flow Areas > Compute 2D Flow Areas Hydraulic Tables.
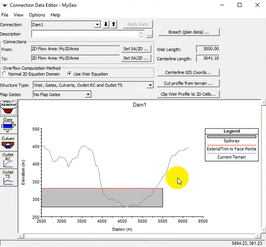
5. In the Connection Data Editor click on Clip Weir Profile to 2D Cells... Now in the plot HV Cell Min Elev and TW Cell Min Elev lines will appear.
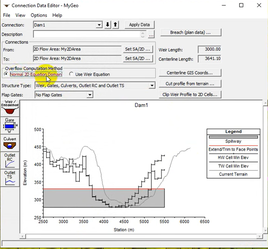
6. Overflow Computational Method: Use Weir Equation or Normal 2D Equation Domain.
4. Gate modelling
Needs to be completed
5. The Breach (parameters estimation)
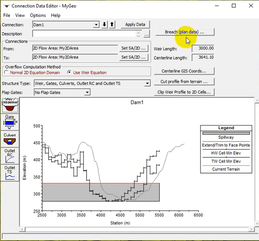
1. In the Connection Data Editor click on Breach (plan data)... A new dialog box will appear.
2. Now you can choose the setting of your simulation.
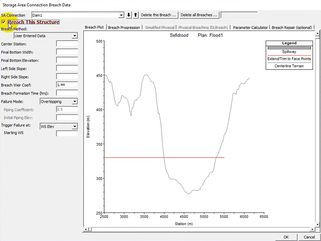
3. In the geometry data, on the Edit buttons section, click on SA/2D Conn button. The dialogue box called Storage Area Connection Breach Data will open.
4. Click on Breach The Structure. Without this option, you cannot simulate the dam-breach.
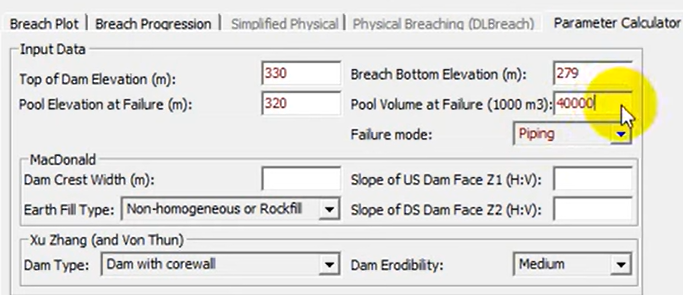
5. Parameter Calculation tab > Input data section
In this section you have to insert the following parameters:
- Top of Dam Elevation: it should be the same elevation of the weir/embankment structure created before.
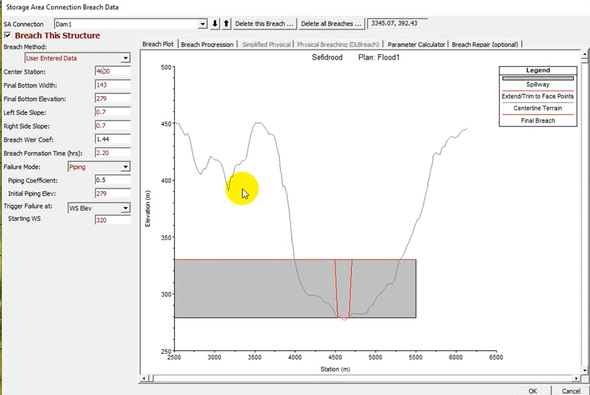
- Breach Bottom Elevation: it is the elevation of the bottom of the breach. For example, it can be equal to the river bottom (you can check it fro the Breach Plot tab).
- Pool Elevation at Failure: it is the water in the reservoir before the dam breaking.
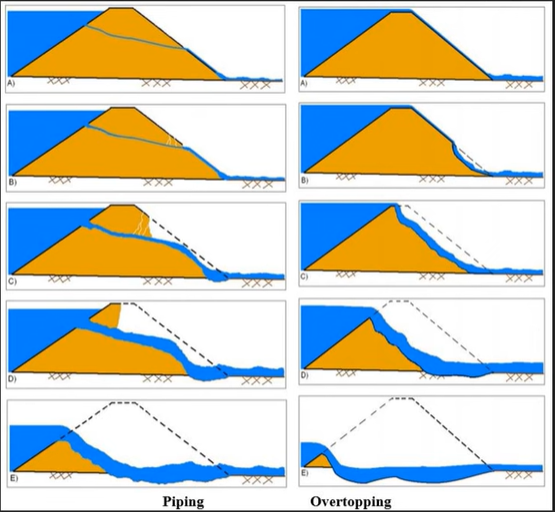
- Failure mode: Overtopping/Piping.
- Overtopping: you have extreme inflow in the lake or reservoir and the water will overtop your dam.
- Piping: the dam breaks because of low material quality after earthquakes.
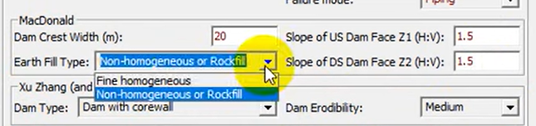
MacDonald Method: (there are no informations available online regarding this method).
- Dam Crest Width (m)
- Slope of Upsteam Dam Face Z1 (H:V)
- Slope of DownStream Dam Face Z2 (H:V)
- Earth Fill Type: choose between Non-homogeneous or Rockfill or Fine homogeneous
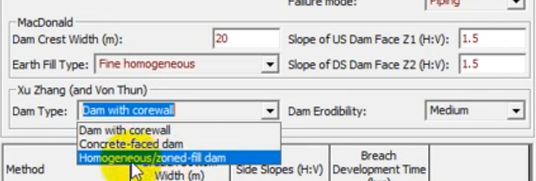
Xu Zhang Method:
- Dam Type: Dam with corewall / Concrete-faced dam / Homogeneous/zoned-fill dam
- Dam Erodibility: Low / Medium / High (if the dam is constructed with low quality material you can select High erodibility).
Below you can read the values for every different method.
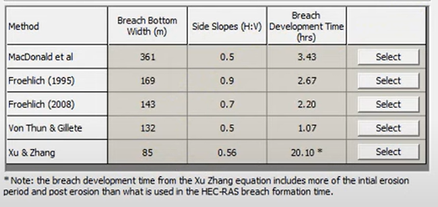
There parameters have a range of values, considering all these methods. What is the correct one?
The Froehlich (1995) (2008) equations are the most practical and widely used for studying the dam breach simulations. They gives low uncertainty and error estimating bridge bottom width and breach development time. Between the two versions of the Frohelich equations, use the 2008.
Click on Select. The model automatically will select the values and put them in the left side.
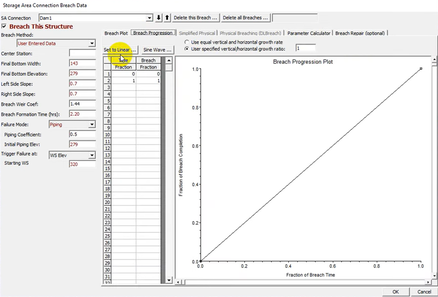
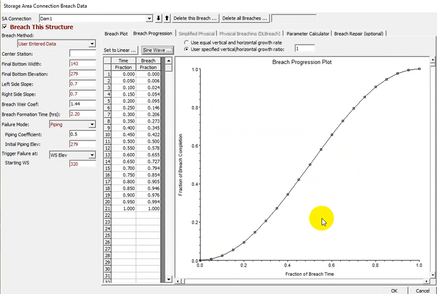
Open the Breach Progression tab. You have two different options: the linear and the sine wave relationship.
Linear behaviour: the fractional breach time and the fractional breach completion have a linear relationship.
Sine Wave behaviour: generally it is preferred because it describe better the breach progression issue.
Open the Breach Plot tab. Now you have to insert the Center Station of the breach.
Then you can click OK, and you will close this window.
Remember to save the geometry: File > Save Geometry Data
Aggiungi commento
Commenti